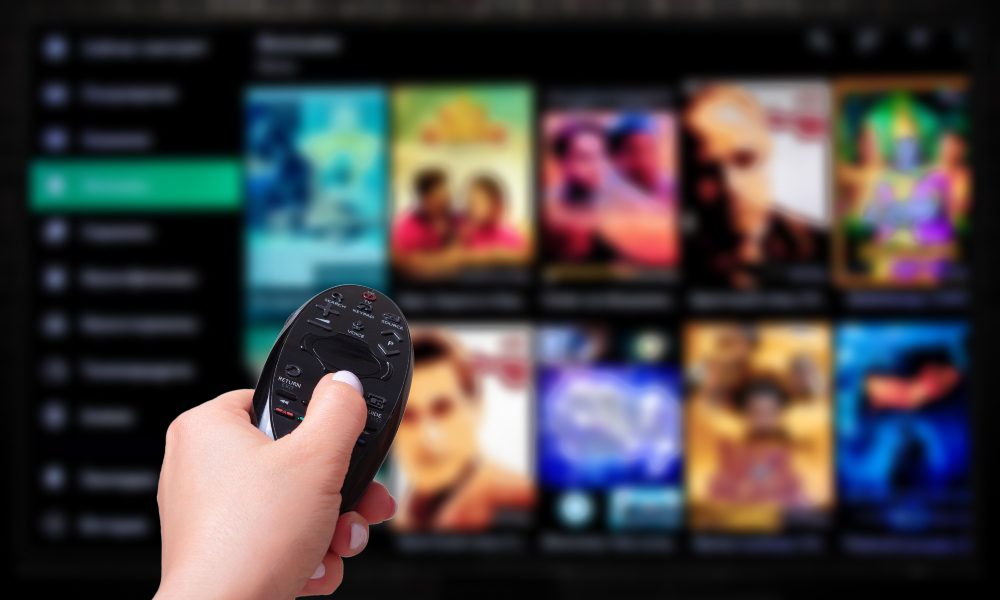
Streaming has become the de facto method for consuming media at home, to the point where streaming has outclassed cable for the number of eyeballs it garners each month. For the longest time, the preferred method of viewing said streaming content has been via smartphones or other mobile devices. According to a report put out by NPAW, a leader in video business intelligence and predictive analytics, the global share of people who stream via smartphones takes up 37% of all viewed streaming content. That trend may be changing, however.
The report itself, titled 2022 Video Streaming Industry Report, examines the evolution of streaming consumption and quality of experience (QoE) trends on a global and regional scale. It also, for the first year in its history, looks into the trends of competing mediums, such as VoD (video on demand) and Linear (Live) TV, as well as the market shares of the most preferred streaming device manufacturers.
Broadcast TV vs. Streaming Quality
Over the course of 2022, the report found Linear TV quality improved vastly, highlighting a tremendous focus on QoE. Similarly, Average Join Times for VoD also increased, suggesting providers are implementing longer time lags to allow for higher-quality video to load and avoid mid-stream buffering.
Despite these improvements, daily consumption by viewers dropped 23% for Linear TV, while VOD viewership dropped by 12%.
The Preferred Devices for Streaming
For streaming devices, smartphones continue to be the most preferred viewing medium, however, large format displays were ultimately where viewers spent the most time watching content. This is correlated by viewership shares of smartphone streaming dropping by seven points, while that of TVs and set top boxes (STBs) rose by six and two points, respectively.

The Future of Digital Lighting & Control
As a custom integrator, lighting is in demand. Effective communication, education and showcasing the value proposition of LED light fixtures in conjunction with integrative control systems are the keys to overcoming challenges and closing sales in this specialized market. Join us as we discuss the future of digital lighting and control with David Warfel from Light Can Help You and Patrick Laidlaw and Mark Moody from AiSPIRE. Register Now!A similar trend was noted for VoD as well, with larger screens (TVs, consoles, and STBs) seeing higher daily consumption in 2022, particularly STBs (+8%).
Smaller screens (smartphones, tablets and PCs), meanwhile, lost daily watching time per user, with smartphones and tablets seeing 6% and 5% decreases respectively.
Large Format Display Preferences by Region
Given the growing importance of big-screen formats, NPAW also decided to look at the top 5 large format display vendors on a regional bases. This ranking system is based on the percentage of total playtime they capture within the market among viewers. These rankings have also been split between VoD viewership and Linear TV viewership.
For VoD in North America, the rankings are as follows:
1. Roku 53%
2. Vizio 12%
3. Amazon Fire TV 12%
4. Samsung 5%
5. Xbox 4%
6. Others 15%
In Europe, viewership seems to be split more among a variety of different large-screen manufacturers:
1. Samsung 23%
2. Google 16%
3. Apple 10%
4. LG 8%
5. Freebox 5%
6. Others 38%
Moving on to Linear TV, Roku continues to dominate the market for large-screen displays in North America:
1. Roku 60%
2. Amazon Fire TV 30%
3. Apple 2%
4. Google 1%
5. Sony 1%
6. Others 6%
And in Europe, viewership is once again spread out across a variety of different manufacturers:
1. Amazon Fire TV 16%
2. Samsung 15%
3. Google 12%
4. Apple 9%
5. Motorola 7%
6. Others 42%
As far as what content people are watching, sports emerged as a colossal driver of viewer interest in the report.
If you enjoyed this article and want to receive more valuable industry content like this, click here to sign up for our digital newsletters!


